TikTok Analytics Guide: Understand Your Video Performance
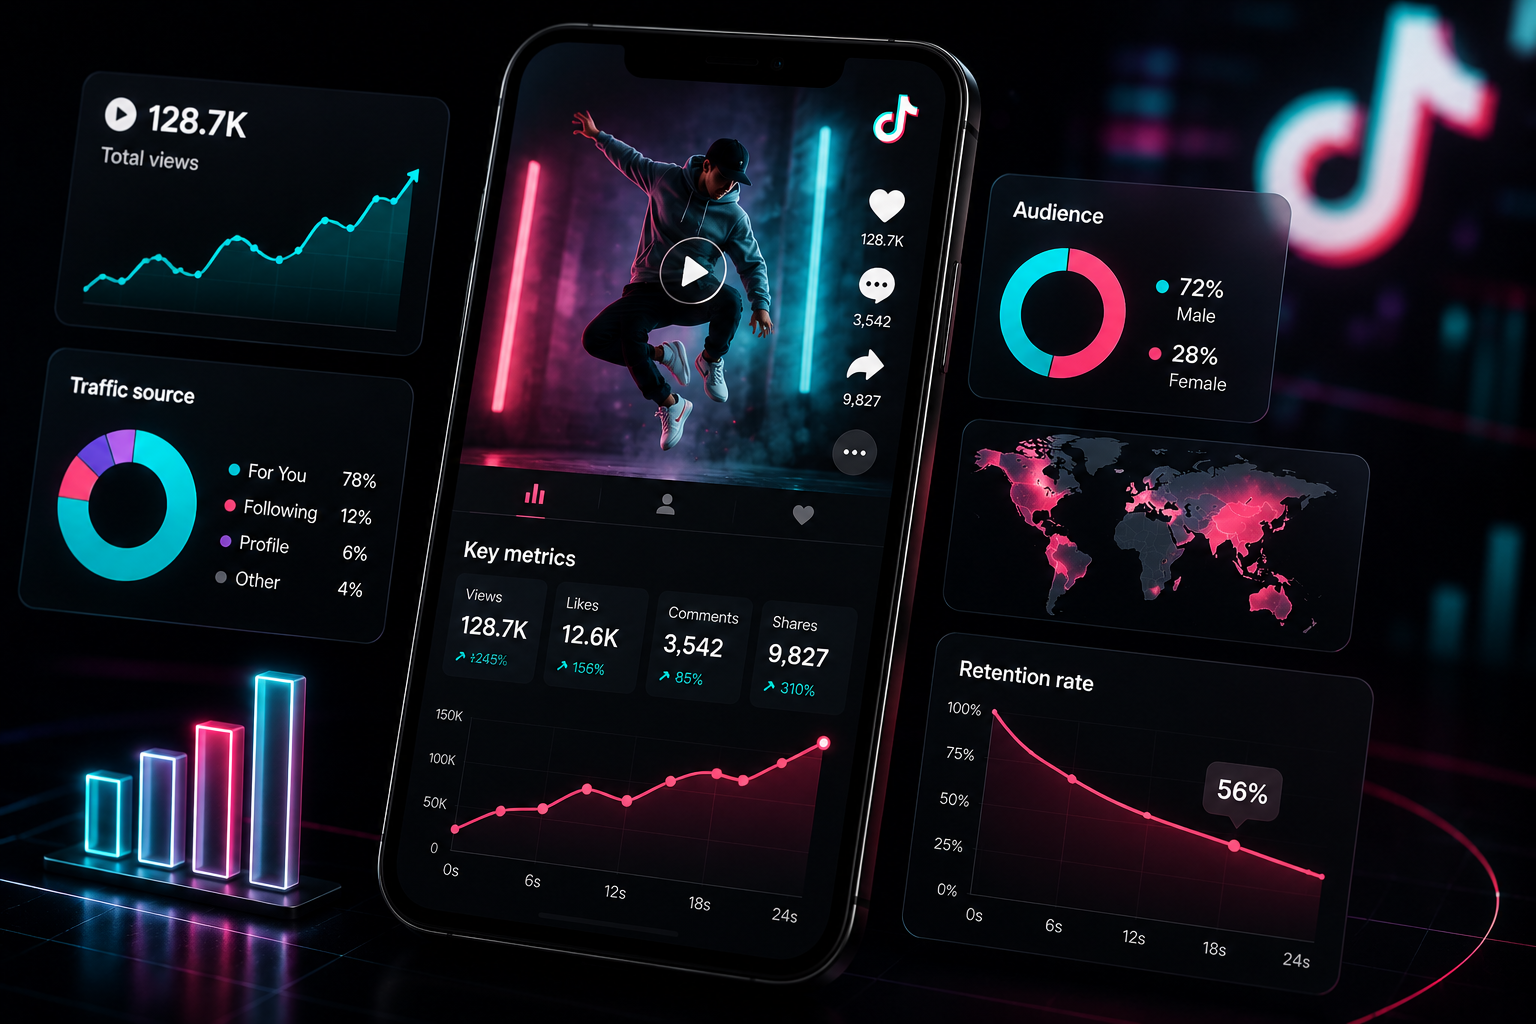
Table of Contents
- Setting Up for Success: Activating Creator Pro Views
- Profile Overview Metrics vs. Real Impact
- The Holy Grail: Decoding the Retention Curve
- Audience Tracking and Peak Activity Syncing
- Traffic Source Types: Where Do Your Views Come From?
- Transforming Analytics Insights Into Better Content
- Frequently Asked Questions
Setting Up for Success: Activating Creator Pro Views
Many video creators publish content for months without looking at their data, relying entirely on vanity metrics like view counts. To build a sustainable growth engine on TikTok, you must switch from guesswork to precise analytics tracking. Accessing this data requires verifying that you are using a complimentary Creator Account or Business Account via your profile settings panel.
Once activated, the analytics console opens up a deep look into your performance data, tracking trends over 7-day, 28-day, or 60-day custom windows. Viewing these numbers on a desktop browser provides a much clearer picture than looking at them on a phone screen, allowing you to export CSV spreadsheets to track long-term performance growth patterns across your content portfolio.
Profile Overview Metrics vs. Real Impact
When you first open your dashboard, the system presents the Overview Tab. This view offers a broad look at your digital presence by tracking three primary metrics:
- Video Views: The absolute volume of times your content pieces were rendered across user feeds. A core baseline metric, but it lacks depth on its own.
- Profile Views: How many users were intrigued enough by a specific video to click through to your main landing channel. This acts as a primary indicator of your profile's conversion power.
- Net Follower Velocity: The net growth speed of your audience base. If video views spike but profile views and followers remain flat, your content is driving short-term attention rather than building long-term audience loyalty.
To evaluate these metrics effectively, calculate your profile conversion rate: divide your total profile views by your overall video views. If this metric drops below 2%, your video content isn't providing a clear enough reason for viewers to discover who is behind the camera. Consider refining your profile branding or pinning high-value introductory videos to your grid.
The Holy Grail: Decoding the Retention Curve
Navigate deeper into individual video metrics to find the most critical chart in modern social media management: the Audience Retention Curve Chart. This chart maps out the exact percentage of viewers watching at any precise timestamp throughout your video's duration.
A typical retention curve shows a sharp decline in the first two seconds, followed by a gradual slope downward. Your goal is to flatten this curve as much as possible. Look for sudden drops in the line—these indicate moments where your pacing slowed down, a visual transition dragged, or your messaging lost its focus. Conversely, look for upward spikes in the graph; these show moments where viewers paused, rewound, or looped the video to catch a detail they missed. Identifying these high-value moments tells you exactly what kind of content formats you should repeat in future videos.
Audience Tracking and Peak Activity Syncing
The Followers Tab reveals exactly who is consuming your content. This section provides critical demographic breakdowns, including gender distribution percentages and top country locations. For brands and creators targeting localized audiences, ensuring your primary viewer base matches your target geography is essential for monetization success.
Scroll down further to find the **Follower Activity Graph**. This module tracks exactly what hour of the day your followers are actively scrolling through their feeds. Do not blindly follow generic internet advice about the best overall times to post. Instead, look at your unique audience graph, find the peak hour, and post your content roughly 45 to 60 minutes before that wave hits. This timing ensures your video is fully processed and indexed by the system right as your primary audience opens the app.
Traffic Source Types: Where Do Your Views Come From?
Understanding exactly how users land on your content is critical for refining your optimization strategy. The engine breaks down traffic sources into four primary categories:
For You Feed: This represents the gold standard of distribution. It indicates that the system recommendation engine is actively pushing your content to non-followers' primary feeds. For a video to go viral, this value should ideally sit above 85% of your total view volume.
Personal Profile & Following Feed: These metrics reveal how your existing community interacts with your content. If your personal profile traffic is high, it means viewers are actively searching for your handle or exploring your pinned grid items to watch past videos. Meanwhile, the following feed tracks distribution to users who already follow you, helping you gauge core community loyalty.
Search Indexing: This tracking node reflects traffic generated by users typing specific terms into the search bar. If you see a steady stream of traffic from search queries weeks after a video drops, your keyword optimization is working, transforming that video into a long-tail discovery asset.
Transforming Analytics Insights Into Better Content
Data without action is just numbers. To scale your platform presence, build a weekly workflow around reviewing your analytics. Group your top three highest-performing assets from the past seven days and find their common elements. Did they use similar hook structures? Was the visual pacing faster? Did they feature a specific audio track or sound format?
Likewise, look closely at your lowest-performing assets to identify common friction points. If your video views are hitting a ceiling at 200 to 300 views, the data is telling you that your test groups are swiping away early, or your content is failing to trigger engagement loops. Use these insights to constantly adjust your production framework—doubling down on formats that hold viewer attention and phasing out visual structures that cause people to scroll away.
Frequently Asked Questions
Why does a video sometimes get stuck at exactly 200 views?
This is often called the "200-view jail." It means your video passed through the initial test pool, but its watch time velocity or completion rate fell short of the threshold needed to trigger the next tier of distribution. Focus on upgrading your first 3 seconds to keep viewers from swiping away early.
How long does it take for video performance data to appear in the dashboard?
While basic view and like counts update in near real-time on your public profile, deeper performance metrics—like retention curves, traffic source breakdowns, and viewer demographics—take 24 to 48 hours to process and display in your analytics console.
What is a good average watch time percentage for a 15-second video?
For a short 15-second video, aim for an average watch time percentage of 70% or higher, alongside a total completion rate above 40%. For longer-form content running over 60 seconds, maintaining a completion rate between 15% and 20% is considered strong performance.
Track and Study Viral Content Formats
Want to break down high-performing videos offline? Use our free tool suite to download public benchmark clips smoothly and analyze their pacing frameworks frame by frame.
Open TikTop Downloader